This formula includes the following functions:
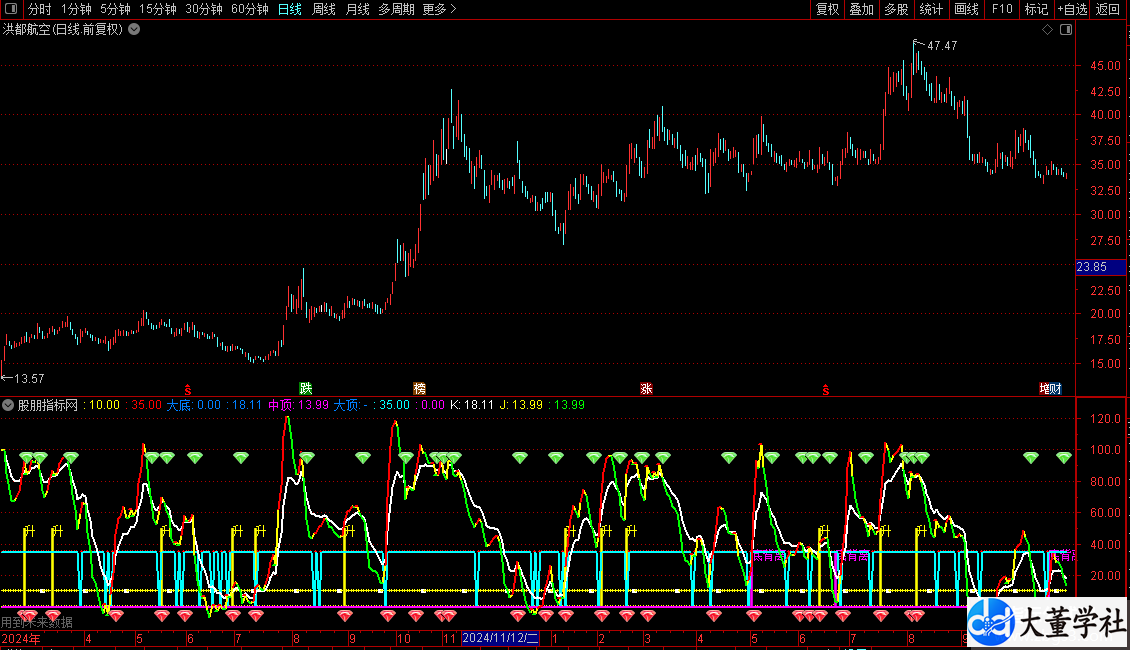
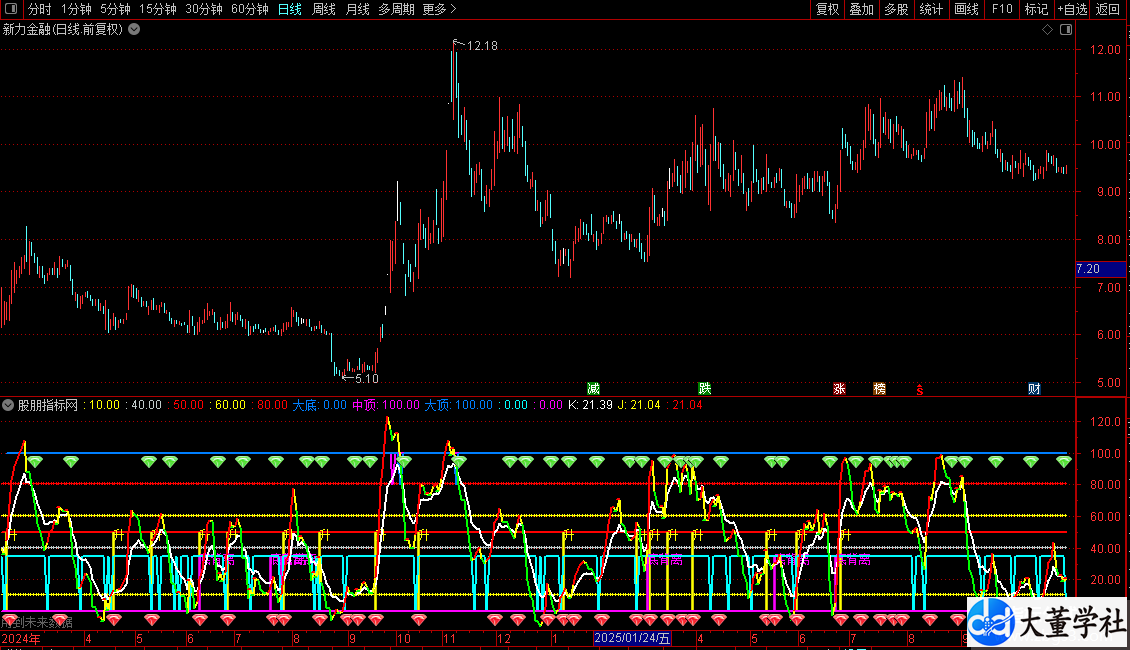
1. Horizontals: Draw reference lines of different colors at positions 10, 40, 50, 60, and 80 to determine price strength ranges.
2. Major Bottom, Mid-Top, Major Top: Calculated using average trading volume, price levels, etc., with “Major Bottom” marked at the 20 position, and “Mid-Top” and “Major Top” marked in the 80-100 range.
3. Resonance: Based on the crossover of short-term and mid-term KDJ indicators, draw colored bars in the 0-50 range and display “Up” to indicate a buy signal.
4. MACD bearish divergence: When the price makes a new low but the DIF does not make a new low, and a golden cross occurs, draw a colored bar within the 0-35 range and display “bearish divergence” to signal a bottom reversal.
5. Buy: Combine momentum indicators and trend lines, draw lines in the 0-35 range, and signal buy opportunities.
6. KDJ: Displays K, D, and J lines. The rise and fall of the J line are distinguished by red and green colors, and icons are drawn at golden cross and dead cross positions.
How to use: Copy the code to the Tongdaxin formula manager, create a new technical indicator formula to use.